The Decade Range: What Long Sideways Markets Teach Us, and Why XRP Is Positioned for a Major Repricing

This is Bayberry Capital research and opinion, not investment advice. Bayberry Capital holds a position in XRP. Read the full disclosure at the end.
Bayberry Capital's view is that XRP is in the late stage of a multi-year range resolution, and that its market structure now resembles the setups that preceded major repricings in other assets. This report lays out the historical evidence behind that view, the mechanism that drives it, and the levels that would confirm or invalidate it.
A decade-long trading range is not dead time. It is a slow transfer of ownership from holders anchored to a prior peak toward holders whose cost basis sits inside the range. Across eight historical cases, from the Dow Jones of the 1970s to silver in the 2010s, the same pattern recurs: an identifiable overhang, a long rotation of holders, and a resolution triggered by a change in regime rather than a single headline.
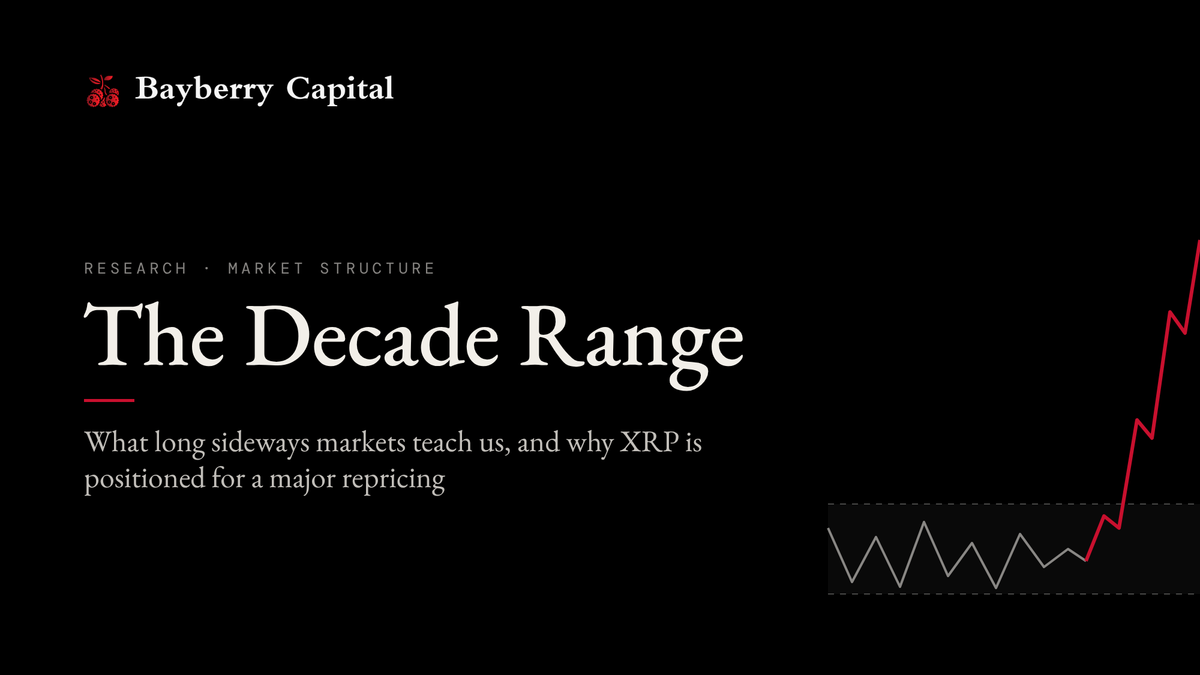
XRP fits that pattern closely. It spent roughly seven years inside a band of about $0.20 to $0.90 under a known legal overhang. That overhang has since been removed. Price broke above the band in late 2024, overshot to a high near $3.65 in July 2025, and has spent 2026 consolidating between roughly $1.00 and $1.65, still above the old ceiling. In the framework below, that sequence reads as a first breakout followed by a retest, the phase that historically precedes the durable move.
Key Findings
- Time does the work price cannot. Long ranges exhaust overhead supply through attrition. Duration is the mechanism, not a side effect.
- Fundamentals and price often decouple. Amazon and Microsoft grew their businesses many times over while their share prices went nowhere for a decade. The ranges reflected valuation resets, not business failure.
- The first breakout often fails. The S&P 500, gold, and the Nikkei each had a failed or partial breakout before the durable one. A retracement after the first move is normal, not disqualifying.
- Catalysts are structural. Long ranges end when an overhang is removed: a regulatory cloud lifts, a monetary regime shifts, or a supply source dries up.
- Confirmation is the old ceiling holding as support. For XRP, that ceiling sits near $0.90 to $1.00. It has held through 2026 on a monthly closing basis.
Defining a secular range
A secular range is a period of five or more years in which an asset repeatedly fails to sustain moves beyond a defined ceiling and floor. Price may spike outside the bounds, but it does not hold there on a monthly or quarterly closing basis. Three criteria separate a true secular range from ordinary consolidation:
- Multiple tests of both boundaries. At least two clear rejections at the ceiling and two defenses of the floor.
- Duration that spans at least one full macro cycle. The range survives a change in rate direction, a liquidity expansion, or a risk-off episode. That shows the bounds are set by holder structure, not by one macro condition.
- Log-scale definition. Over a decade, the meaningful measure is percentage distance. A range from $0.20 to $0.90 is a 4.5x band, and boundaries, targets, and stops should be framed in those terms.
Short consolidations resolve through new information. Decade ranges resolve through change in the holder base. Every unit of overhead supply was bought by someone with a cost basis and a pain threshold, and those holders exit in stages: at breakeven, at capitulation lows, or through fatigue. A ten-year range is therefore structurally different at year nine than at year two. The chart looks the same; the order book does not.
Why long ranges form
Most decade ranges begin after a speculative peak and persist because four forces hold price in balance at once.
1. Supply overhang from the prior peak. A blow-off top leaves a large cohort of holders underwater. Each rally toward their cost basis meets selling from investors who want only to get out whole.
2. Valuation reset while fundamentals grow. Amazon peaked in December 1999, fell more than 90% by 2001, and did not reclaim its 1999 high until 2009. Over the same decade, annual net sales grew from about $1.6 billion to about $24.5 billion. Microsoft peaked near $60 in late 1999, roughly tripled earnings over the next decade, and did not sustainably clear that high until 2016. In both cases the business compounded while the price digested a bubble.
3. Macro regime that caps multiples or real returns. The Dow Jones Industrial Average first approached 1,000 in 1966 and did not decisively leave that level until late 1982, while consumer prices roughly tripled. For gold, positive real rates played the same role from the 1980s into the early 2000s.
4. Structural overhangs specific to the asset. Some ranges are held in place by a known, unresolved risk: litigation, regulatory classification disputes, scheduled supply releases, or central bank sales programs. Capital waits on the sidelines, and when the overhang is removed, that latent demand arrives together.
The longest ranges combine at least two of these forces. A pure supply overhang tends to clear within three to five years. Layer a valuation or regulatory overhang on top, and the range can persist for a decade or more.
Internal anatomy of a decade range
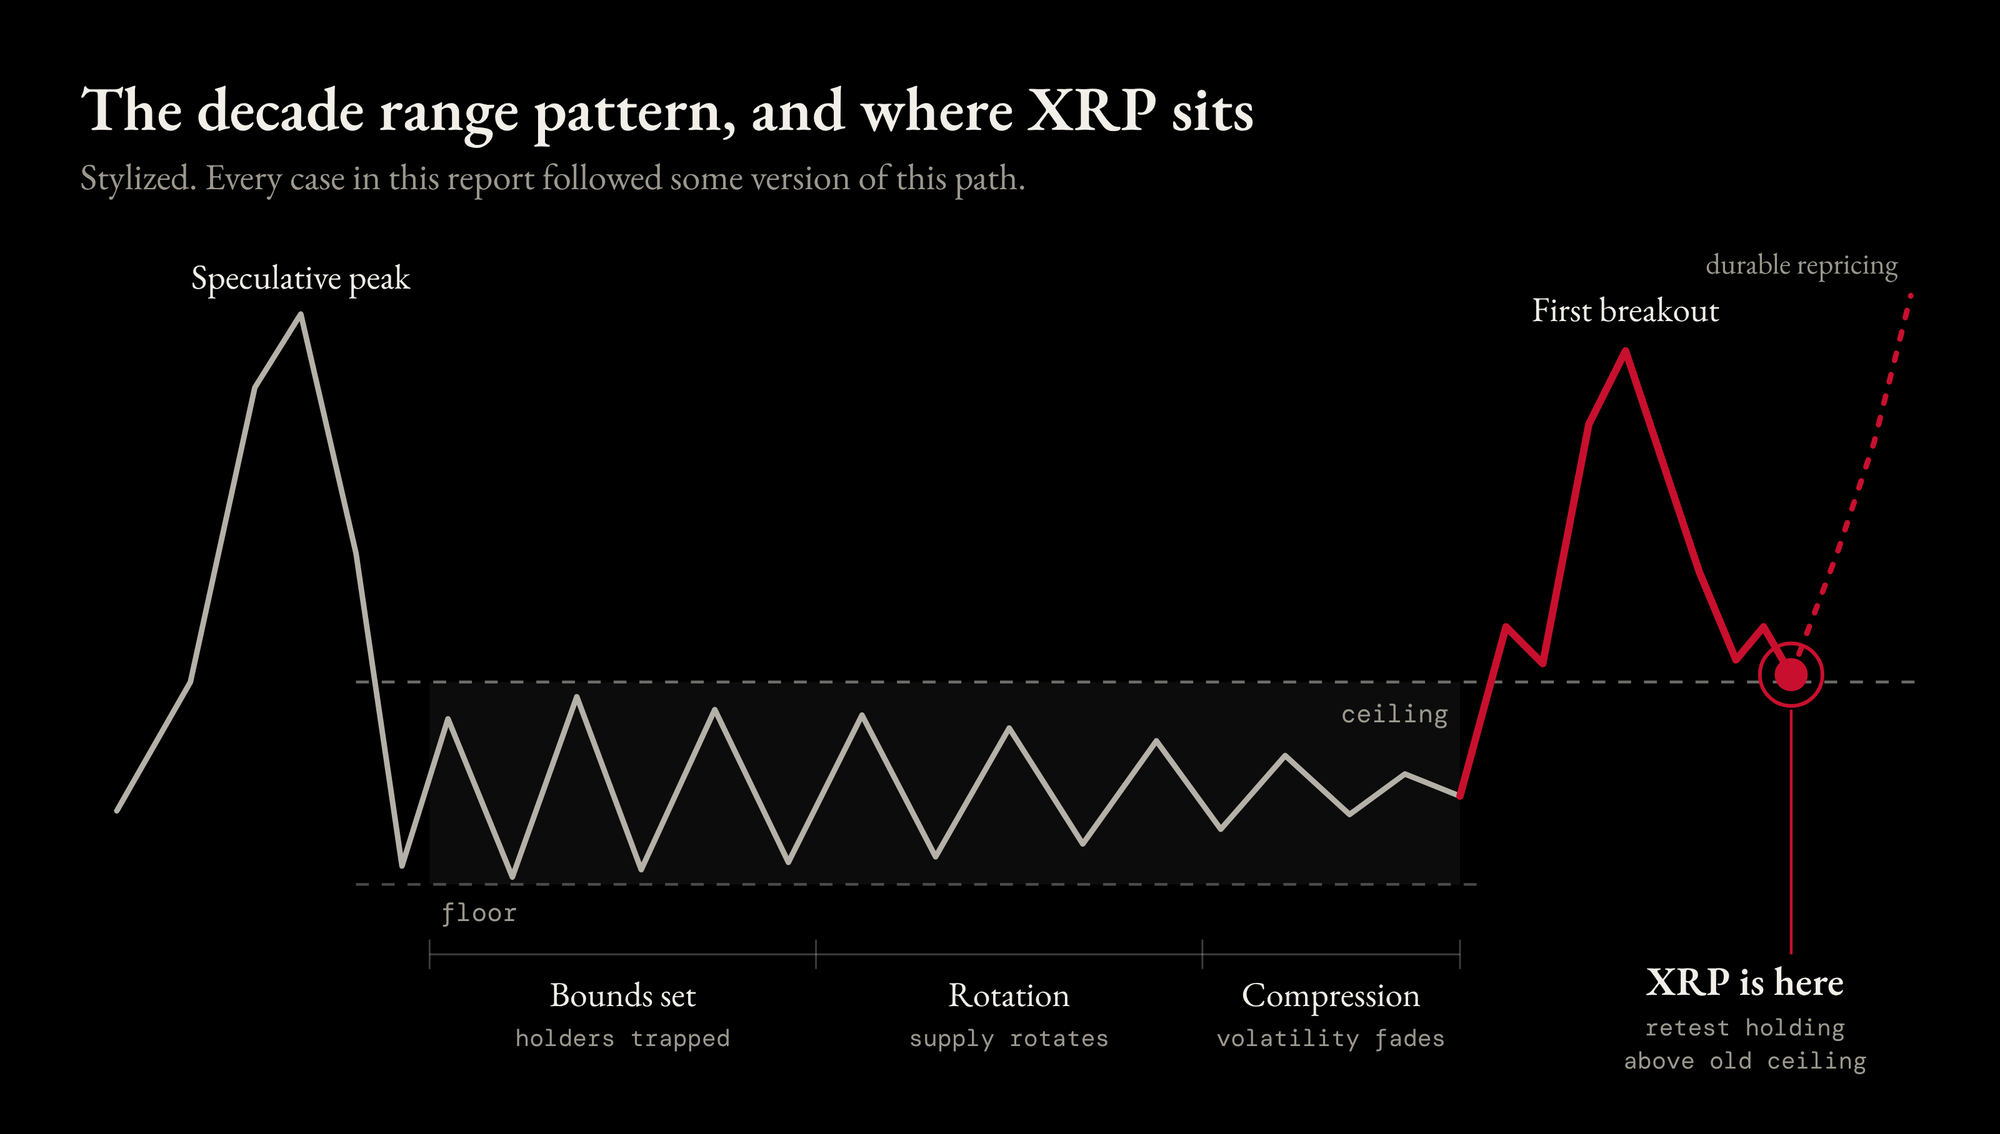
- Phase 1, discovery of the bounds (years 1 to 3). Price falls hard, rebounds sharply, and retests. Most participants still treat the old high as the reference point.
- Phase 2, rotation and attrition (years 3 to 7). Price oscillates between bounds with each swing less violent than the last. Peak-era holders sell into rallies; lower-cost buyers absorb dips. Attention fades.
- Phase 3, compression (final 12 to 36 months). The range narrows and realized volatility reaches multi-year lows. Years of mean reversion have trained participants to sell volatility, which is the positioning that amplifies the eventual move.
Phase 4, resolution. A catalyst or exhausted supply pushes price through a boundary on a closing basis. The move is fast and is usually followed by a retest. A successful retest, where the old ceiling holds as support, is the strongest confirmation available.
The dominant emotion inside a long range is not fear; it is boredom. Many holders sell near the end of the range, not because the thesis failed, but because they ran out of patience.
Historical case studies
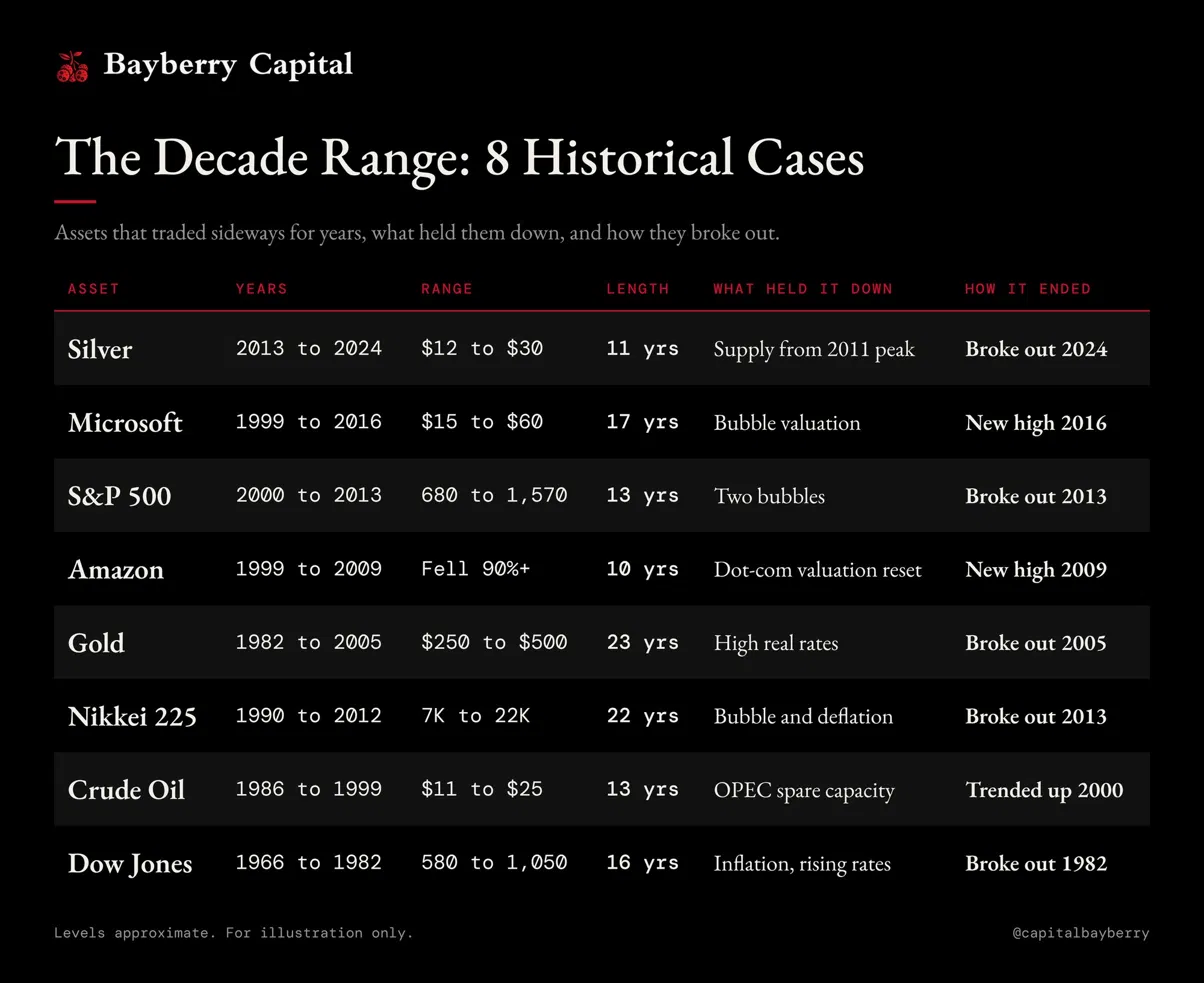
Eight well-documented episodes across equities, indices, and commodities show the same structure. All levels are approximate.
What the cases have in common:
- The overhang was identifiable in advance. Participants could name what was holding price down. The difficulty was timing its removal, not identifying it.
- Resolution coincided with a regime change. Falling rates in 1982, a new monetary policy in Japan in 2013, a shift in real rates for gold. Single headlines rarely ended a decade range.
- The first breakout attempt often failed. The S&P 500 reached its 2000 high in 2007 and collapsed. Gold rallied in 1987 and 1996 before the real move. A failed or partial attempt frequently precedes the durable one.
- Post-breakout moves were large relative to the band. Once resolved, most of these assets covered at least the height of the prior range within one to three years.
How decade ranges resolve
The upside cases in this report share a common path: a speculative peak, years of rotation inside the range, compression, a first breakout, and a retest of the old ceiling before the durable move. That retest is where XRP sits today.
Not every range ends this way, and disciplined analysis has to account for the alternatives.
Outcome A, upside breakout. Price closes above the ceiling on a monthly basis, retests it as support, and trends higher. Above a multi-year ceiling there are no recent buyers waiting to break even. A common rough guide is the measured move: the range's height projected from the breakout, in percentage terms. Target = Ceiling × (Ceiling ÷ Floor).
Outcome B, downside breakdown. Price closes below the floor and fails to recover it. General Electric traded sideways for most of the 2010s before breaking sharply lower in 2017 and 2018.
Outcome C, perpetual range. Price never decisively resolves, and opportunity cost becomes the dominant loss. The Nikkei took 34 years to reclaim its 1989 high.
There is no reliable statistical base rate for these outcomes; the sample is small and shaped by survivorship. That is why a thesis must rest on mechanism and confirmation, not on the chart alone.
Signals that precede resolution
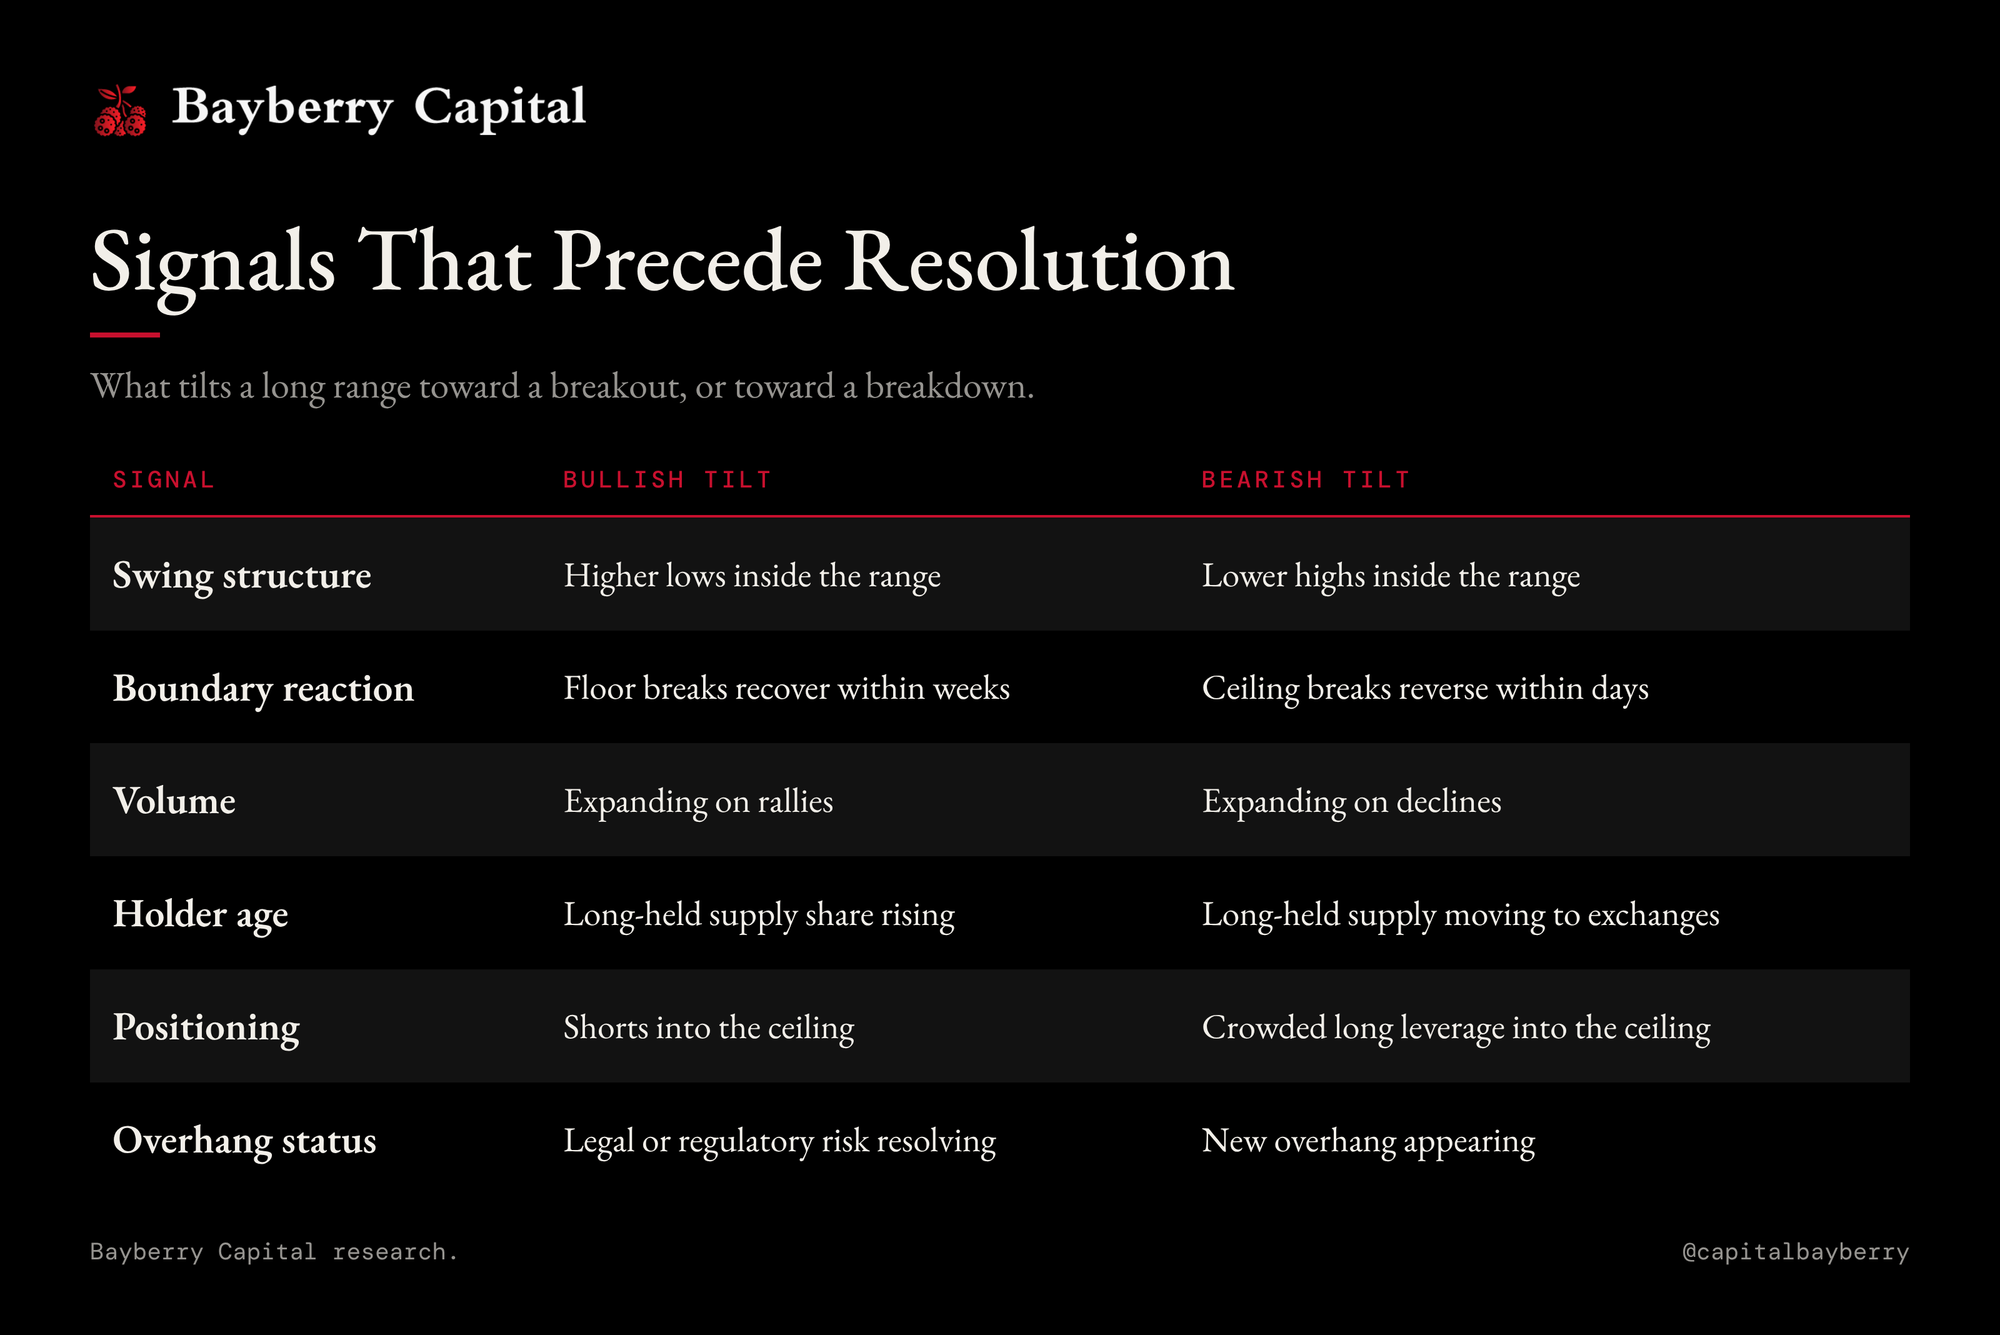
A breakout should be treated as provisional until it meets three tests: a monthly close beyond the boundary, a successful retest of the broken level, and follow-through from new participants rather than leverage alone.
Applying the framework to XRP
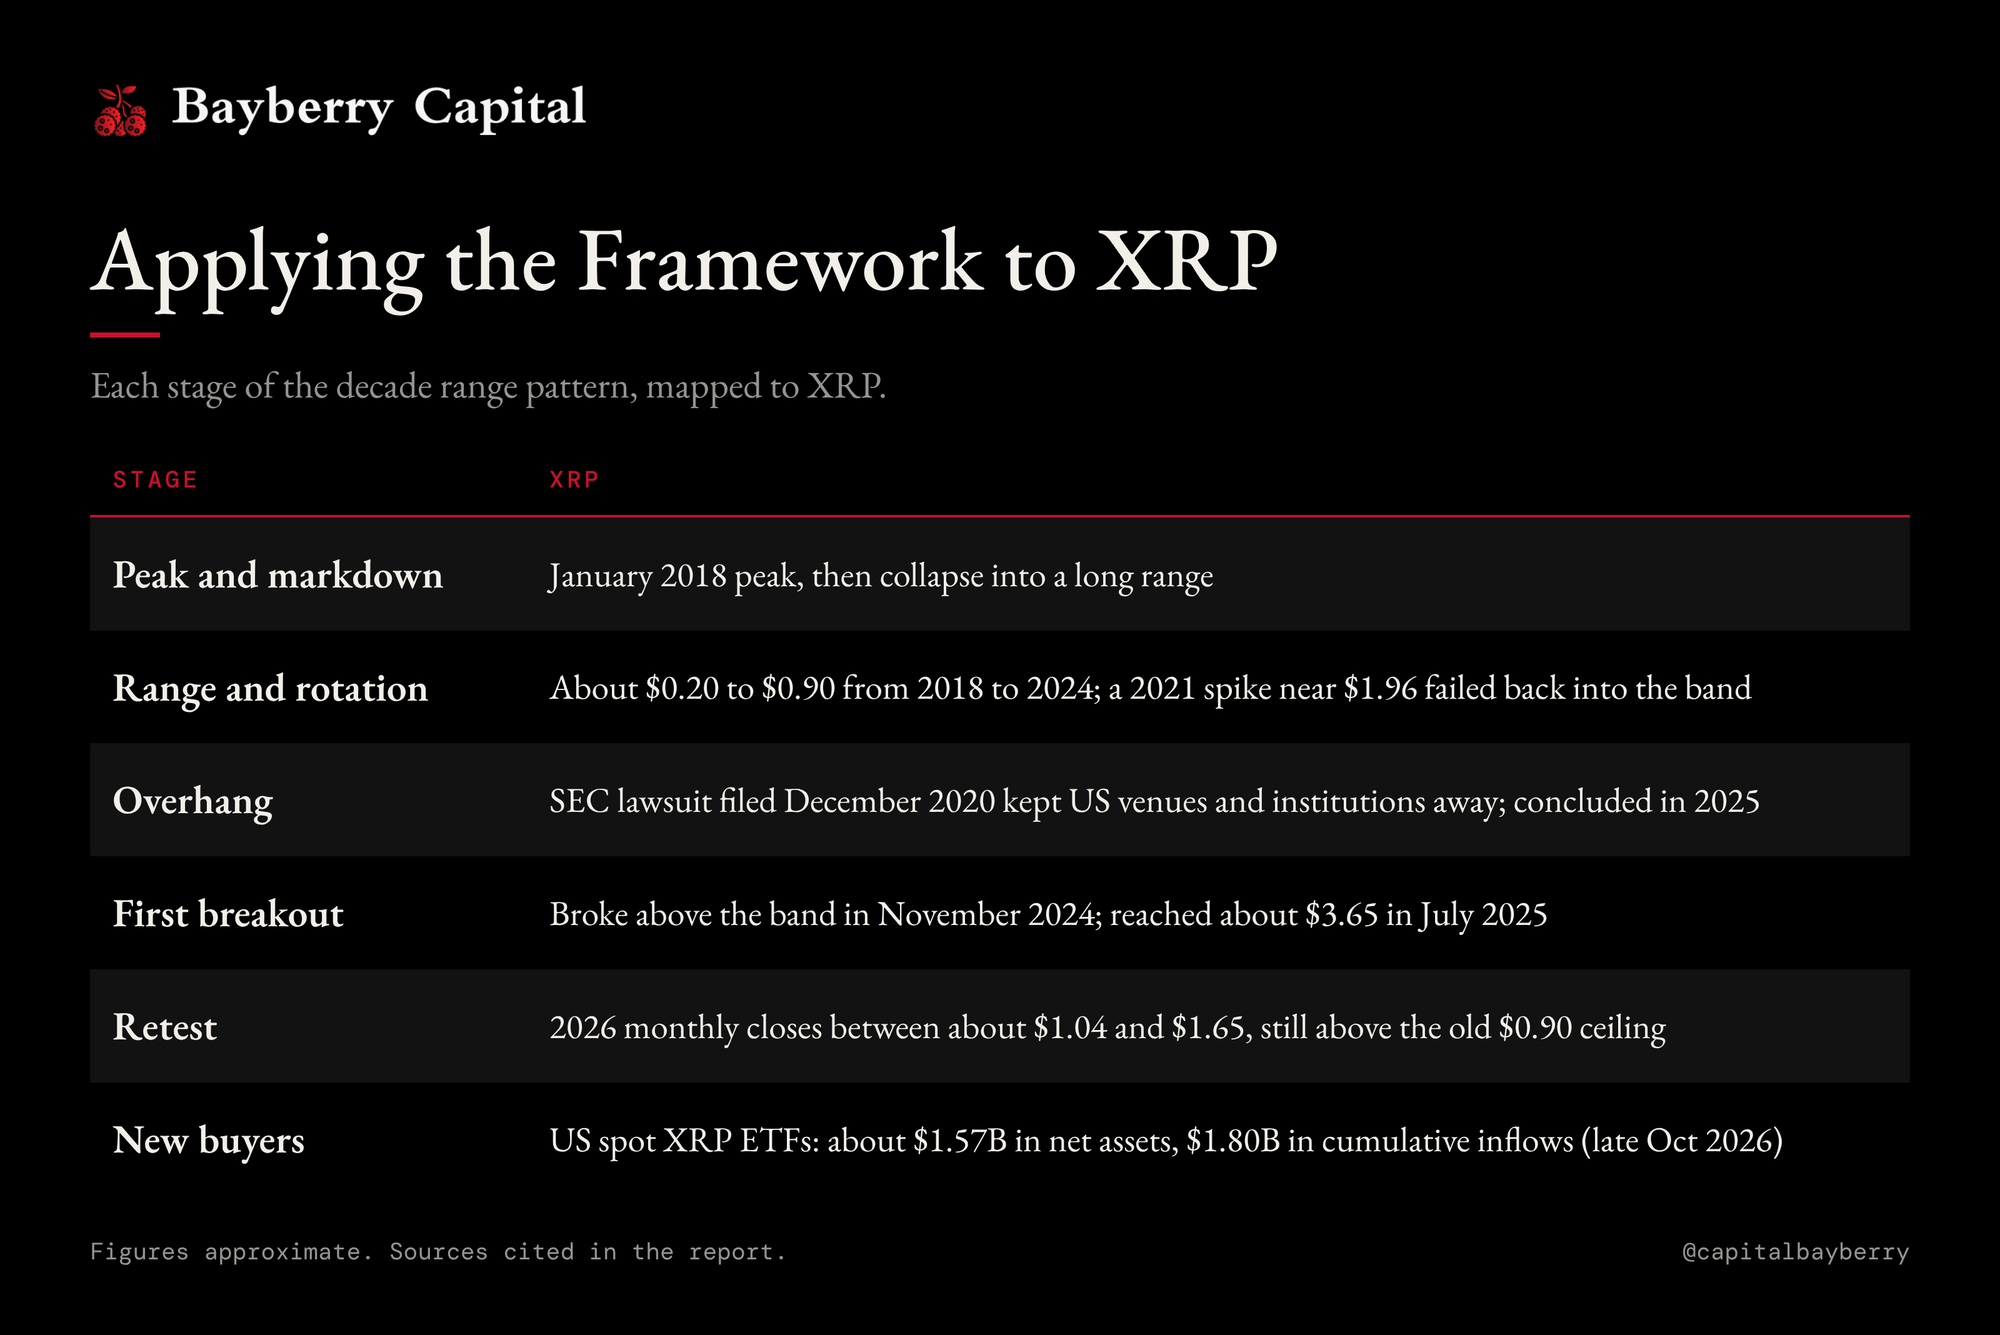
XRP is the clearest modern example of a range held in place by an explicit structural overhang, and its current price action maps onto the late stages of the framework.
Why we read this as setup, not failure
The 2025 move was a first breakout, and first breakouts in this record are frequently followed by sharp retracements. What matters is where the retracement stopped. Through 2026, XRP has held above the ceiling of its seven-year range on a monthly closing basis. In the framework, a former ceiling acting as support is the strongest confirmation available. Three further conditions line up with the historical cases:
- The overhang is gone. In every case studied, removal of the identifiable overhang preceded the durable repricing.
- The holder base has rotated. Seven years inside the band, followed by a full round trip from $3.65, has transferred a large share of supply toward holders with lower cost bases and longer horizons.
- A new class of buyer exists. Regulated ETF access gives institutions and advisors a channel that did not exist during the range.
Scale of the potential repricing
Applying the measured-move heuristic to the 2018 to 2024 band gives a projection of roughly $4.05 ($0.90 × 4.5). That figure is a framing tool, not a price target, but it places the 2025 high of $3.65 short of a full measured move, consistent with a first attempt rather than a completed one.
What would confirm the thesis: continued monthly closes above $1.00, a monthly close above the 2026 high near $1.65, and sustained ETF inflows rather than episodic ones.
What would invalidate it: a monthly close back below $0.90, which would return XRP to its old range.
Risks to the thesis
- The retest could fail. If $0.90 to $1.00 does not hold, the 2024 to 2025 move becomes a failed breakout.
- ETF demand has been uneven. Flows have included zero-inflow days and outflows in 2026.
- Macro and crypto-wide risk. XRP remains correlated with the broader digital asset market, which has been under pressure from rate expectations in 2026.
- Survivorship and narrative fitting. The historical cases are assets that resolved upward and still trade.
Conclusion
A decade-long range is a market working through its own history. The ceiling is made of prior buyers and unresolved doubts; the floor is made of holders who believe the asset still matters. For XRP, the doubt that defined its range has been removed, the first breakout has occurred, and the retest has so far held above the old ceiling. That is the sequence that, across the historical record, has preceded major repricings.
The task is not to predict the date. It is to identify the overhang, confirm its removal, watch the retest, and act decisively when the market confirms the new regime. On each of those measures, Bayberry Capital believes XRP is positioned for its next leg.
Disclosure. This report is for informational and educational purposes only and reflects the opinions of Bayberry Capital as of its publication date. It is not investment, financial, legal or tax advice, and it is not a recommendation or solicitation to buy or sell any asset. Bayberry Capital holds a position in XRP and may buy or sell at any time without notice. Digital assets are highly volatile, and you can lose some or all of your investment. Price levels, projections and measured-move figures are illustrative frameworks, not price targets or guarantees. Past performance of any asset, including the historical cases discussed here, does not predict future results. Historical levels are approximate. Current XRP figures are sourced from 24/7 Wall St. (October 22, 2026) and Analytics Insight. Do your own research and consult a licensed financial professional before making any investment decision.